Chem 1200
Greenhouse Gases I
"The Earth system follows laws which scientists strive to understand,"
said Dr. F. Sherwood Rowland, a Nobel laureate in chemistry.
"The public deserves rational decisionmaking based on the best scientific advice about what is likely to happen, not what political entities might wish to happen."
From: Preeminent Scientists Protest Bush Administration's Misuse of Science

When I first added "Greenhouse Gases" as a topic in my General Chemistry, I shared with another Filipino American scientist the slides I prepared for that first lecture. This was back in 2008 and the following was his response.

My son, Alexander, was two years old then. I took the following photos when he was just several months old.


Josefino "Joey" Comiso is a scientist at NASA. His contribution to the study of climate change is his observation of the decline in Arctic sea ice during the past decades.


Here Are Current Observations.


And as Joey Comiso noted, these warmer temperatures are evident in the extent of sea ice in the Arctic region. It is lower than the range observed for the past decades.

We also see a shrinking of ice cover in the Antarctic.

In order to understand what is going on, we need to examine the earth's atmosphere. The earth's atmosphere can be divided into several layers:
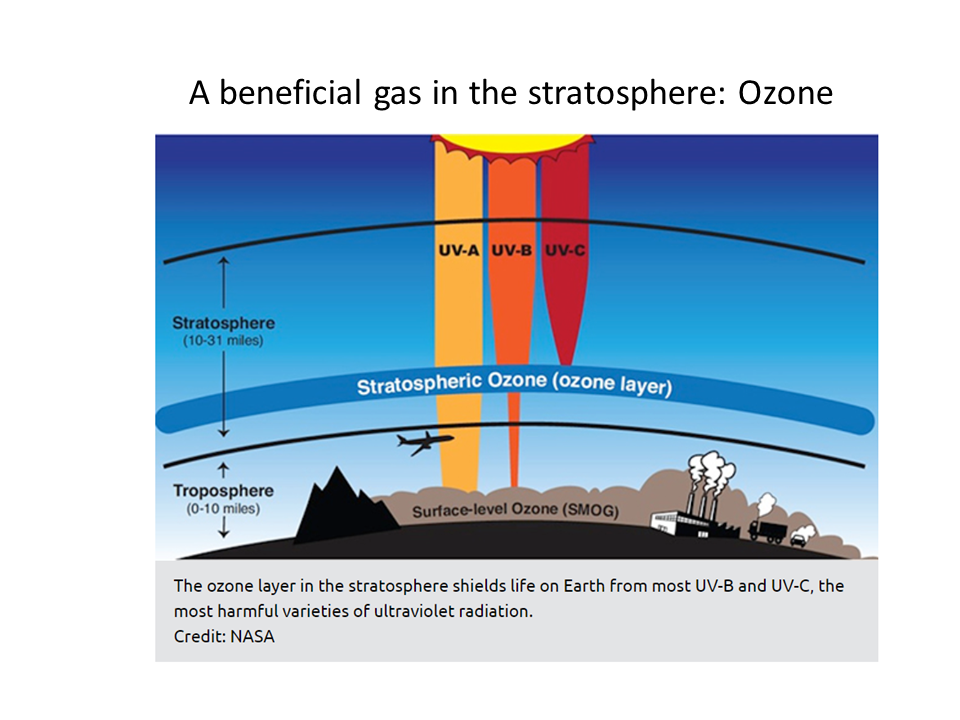
- troposhere; This is the layer directly above us and it stretches up to 10 kilometers in altitude.
- stratosphere: This is right above the trophosphere and here we will find the ozone layer. This is the part of the atmosphere where there is an equilibrium between O3(ozone) and O2(oxygen) molecules. The ozone layer protects us from harmful ultraviolet rays from the sun.
- mesosphere: This lies above the stratosphere, stretching 50 to 85 kilometers from the earth's surface. This is where the temperature decreases with height.
- thermosphere: This lies highest. This is where molecules are ionized by the sun's radiation. Due to these ionizations, the temperature increases as one goes up through this layer.


In order to relate temperature to light, we need to consider the electromagnetic spectrum. Light is composed of photons. And each photon has a characteristic wavelength or frequency. It is either the wavelength or the frequency that allows us to determine the energy that a photon carries. How this energy relates to energy is given by Boltzmann's constant (on a per molecule or photon basis), or the ideal gas constant, if we are dealing with molar quantities.
We compare hv against kT. At room temperature, 298 K, we are near the infrared region. Thus, what is relevant to our planet is infrared radiation.


The rise and fall of CO2 in a year corresponds to the changes in season, which correlates to the times of the year when trees have leaves and are therefore performing photosynthesis. Mauna Loa is north of the equator. During the spring and summer, there is a drop in CO2 since photosynthesis uses CO2. Nonetheless, the overall trend, year over year since the 60's is continuous rise in CO2 levels in the earth's atmosphere.

Below are CO2 levels obtained via satellite, indicating what is observed in Hawaii is happening all over the world.

There is no ambiguity with regard to the source of the additional CO2 in our atmosphere. We are the source.


Although CO2 emissions come from automobiles, a big contributor is power generation. We generate electricity by burning coal, oil or natural gas. Burning coal is the biggest contributor in this sector followed by natural gas. We produce CO2 not only because we drive our cars, but also by heating or air conditioning our homes, keeping our food fresh in our refrigerators, and watching television. CO2 production is attached to our current way of life.


Using the table above, methane has the highest energy released per mole of CO2. To see this, one divides the number seen in the last column by the number of CO2 produced. For methane, this is 890/1 = 890 kJ/mol. For ethane, this is 1560/2 = 780 kJ/mol.

Albedo is the percentage of the sunlight that is reflected from the planet - this is dependent on several factors such as cloud cover, color of the planet surface, atmospheric dust, etc. Venus has a very high albedo because of its cloud coverage, which blocks sunlight from reaching the planet's surface.
The Radiative temperature is derived by taking into account the Solar Constant and the Albedo - which gives the amount of solar energy that is absorbed by the planet's surface. This makes the assumption that when materials absorb light, they re-emit some of this energy as heat. Because Venus' cloud coverage reduces the amount of sun's radiation reaching its surface, its predicted surface temperature is colder than that of Earth eventhough Venus lies closer to the sun.
The last column, Surface temperature, demonstrates vividly the Greenhouse Effect. The difference between the Radiative temperature and the actual Surface temperature is the consequence of the Greenhouse Effect.
Venus is HOT! Earth is livable! Mars is COLD!
Black-Body Radiation (Max Planck)

Any object at a temperature other than absolute zero emits light. The intensity distribution across the wavelengths is given by Planck's equation above. Hot objects will emit light at shorter wavelengths compared to cooler objects.


The light coming from an object gives us the temperature of that object. The wavelength at the maximum of a radiation curve is inversely proportional to the temperature of the radiating body.


Figure copied from :
http://academic.reed.edu/chemistry/courses/chem101/Handouts/IntrotoGreenhouseEffect.pdf
Original source: "The Chemistry of the Atmospheres", Richard P. Wayne, 1991
Earth's radiation peaks at about 20 micrometers and covers a range of 5 to 100 micrometers. Therefore, most of the radiation absorbed by planet earth will be emitted at these longer wavelengths.
No comments:
Post a Comment