Chem 1200
Kinetics III
Dependence of Rate of Reaction on Concentration - The Rate LawMonitoring the concentration of reactants with time

The reaction in the experiment, "Fading of Phenolphthalein" is the following:
As mentioned before, phenolphthalein, a dye commonly used in acid-base titrations, is pink when it is in a solution that is basic. The compound responsible for the pink color is shown as the reactant in the above figure. Notice the extensive network of alternating single and double bonds. Some of the electrons in this molecule are free to move from one of the rings in the molecule to the other rings. It is like a particle in a box, and with the great length electrons can travel through, the difference in energy between the highest filled orbital and the lowest unfilled orbital matches the energy of a photon in the visible region. This form of phenolphthalein, however, can further react with the hydroxide ion, as shown in the above reaction. When this happens, the hydroxide ion adds to the central C atom, removing the double bond that serves as a bridge between the rings. As a result, the product is no longer colored. It is therefore easy to follow the progress of this experiment since one simply has to use spectroscopy to measure how much of the pink form remains in solution. The concentration of the reactant can therefore be followed by measuring the absorbance at a wavelength that corresponds to the complementary color of pink.
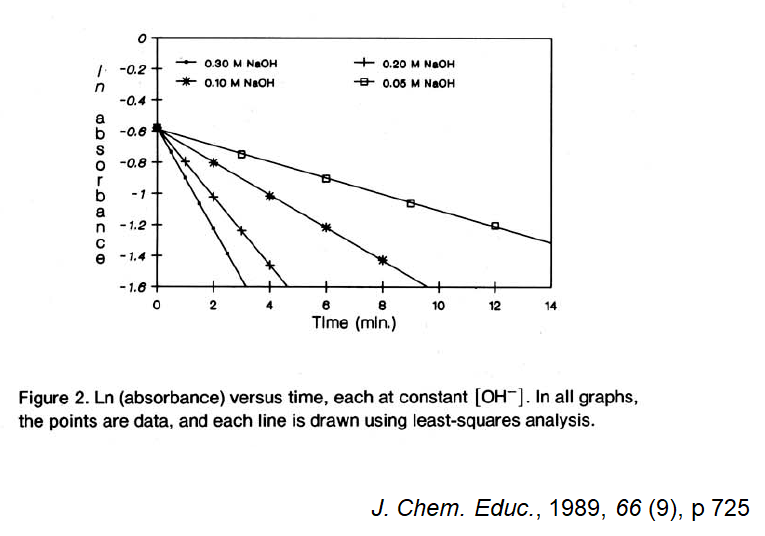
These measurements are summarized in the following figure:
It is not absorbance but the natural logarithm of the absorbance that is plotted against time (We will see the reason behind this type of plot). The four lines represent four separate experiments. Each one is at a different concentration of NaOH. Since the lines are not parallel, one can quickly conclude that the rate is dependent on [OH-]. In fact, by looking at the 0.10 M and comparing this against 0.20 M, one should easily see that the line connecting the 0.10 M points reaches the x-axis at twice the time it takes the line connecting the 0.20 M points. This reaction is first-order with respect to [OH-]. If we plot the slope of each line in the above figure, we will see that the steepness, the rate at which the ln of the absorbance drops with time is proportional to [OH-]:
As we will see later, the fact that it is the ln[Absorbance] that makes a straight line with time means this reaction is first-order with respect to phenolphthalein. The reaction is second-order overall.


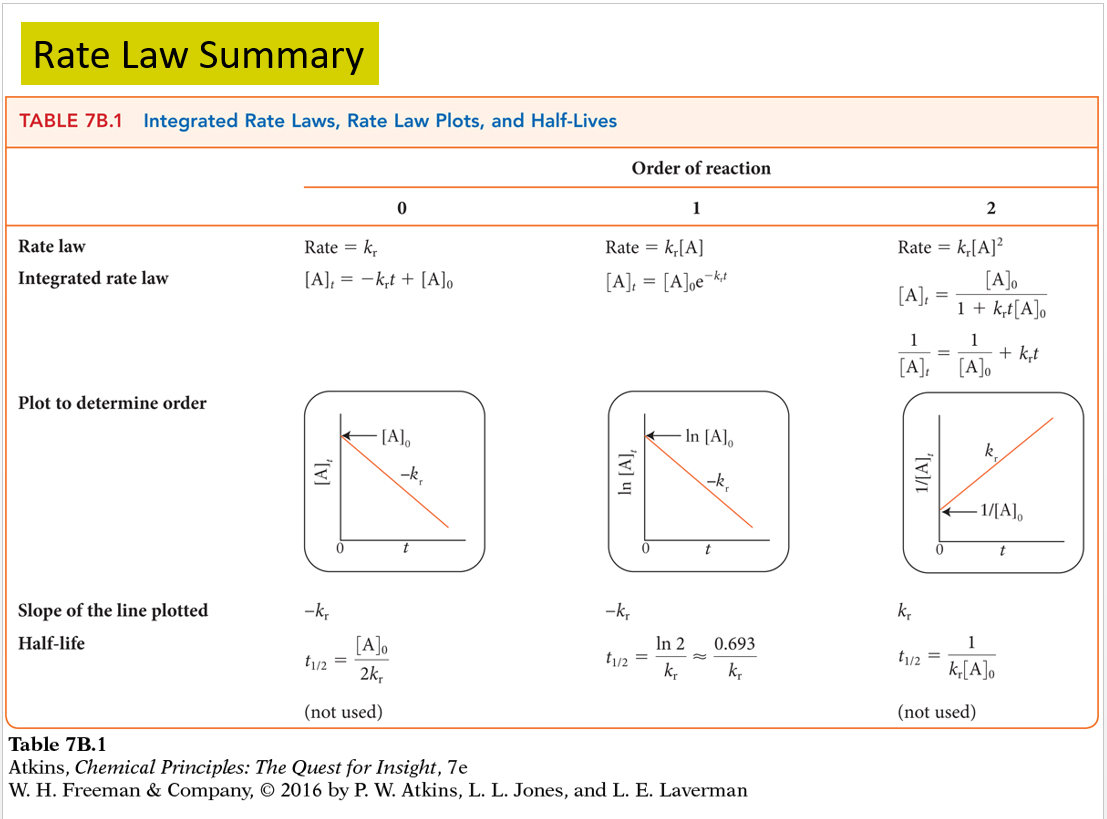
Monitoring the Change of Concentration with Time - Since the rate of the reaction can depend on the concentration of a reactant, we do not normally expect the concentration of a reactant to change linearly with time. If it does change linearly with time, then the rate of the reaction is independent of the concentration of this reactant. The reaction is zero order with respect to a reactant if the concentration of this reactant changes linearly with time.
When the rate of the reaction does depend on the concentration of the reactant then a graph of the concentration of the reactant versus time will not be linear, as in: (The rearrangement reaction of methyl isonitrile CH3NC into acetonitrile CH3CN)


Thus, a plot of ln[A] versus time should yield a straight line with slope = -k. Using this plot, one can see that the rearrangement of methyl isonitrile is in fact first order:


Second order:The above equation shows that if a reaction is second order with respect to [A], a straight line plot can be obtained by plotting the reciprocal of [A] (that is, 1/[A]) versus time, the slope of the line is equal to the rate constant k. An example is the decomposition of nitrogen dioxide at 573 K:
And the resulting plots are as follows:
Time, s [NO2], M ln [NO2] 1/[NO2] 0.0 0.01000 -4.610 100 50.0 0.00787 -4.845 127 100.0 0.00649 -5.038 154 200 0.00481 -5.337 208 300 0.00380 -5.573 263 The ln plot still shows curvature while the reciprocal plot yields a straight line, indicating that the reaction is second order with respect to nitrogen dioxide.

Something Special: Half-lives
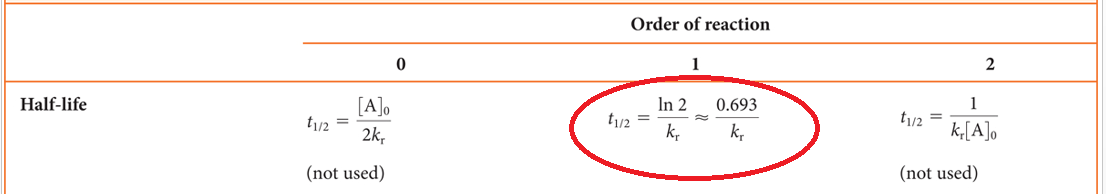
We will discuss this in greater detail.
But first, here is another example of a first-order reaction, an alkyl bromide (hydrocarbon, that is with C and H's, only single bonds are present, plus a bromide) reacts with water to form an alkene (a hydrocarbon with one C=C, this is formed by elimination of an HBr molecule from the alkyl bromide):
Time, hr [alkyl bromide] 0 0.150 1.00 0.106 2.00 0.075 3.00 0.053 4.00 0.0375 5.00 0.0265 Plot ln[alkyl bromide] versus time and you will see a straight line.
No comments:
Post a Comment